About
One of our aims is to drive positive site behaviours through training and data visualisation, and enabling particularly the small- to mid-tier producers who have limited or no instrumentation or monitoring implemented. Clarity's current applications couple edge computing to targeted dashboarding.
Development and Implementation
Two recent implementations of Clarity's remote monitoring approach are given here – one for a tier-three mine operation, with a low level of control and monitoring, in central Victoria, and on the other end of the spectrum, the other for a tier-one mine operation, with a high level of control and monitoring, in central Queensland.
Data is transferred timeously via wireless communications to an secure cloud server and displayed on the dashboard in a standard, platform-agnostic web-browser. For edge devices, finer details of the raw data are collected on the sensor itself, which allows data transfer to catch-up if, for whatever reason, the wireless communication is interrupted.
Central Victoria
Sensors are often designed to output their response as a wired analogue or digital signal. However, this particular site had a low level of monitoring and control, and so Clarity envisaged a new solution which would not only suit these lower-tiered mining operations, but also complement capability of higher-tiered mine operations.
The dashboard in Example 1 was configured to give customised information based on the site, instrument and application.
Mine operations are able to log in securely to view the instantaneous interface level in blue, and the moving average in orange. They can toggle between a daily, monthly and yearly trend, with the current values and operating limits shown on the upper tabs, covering the chosen view period. Time averages can be shown in a number of ways and here monthly averages of the interface level are shown in the lower graph, giving a quick historical overview.
With the dashboard, the mine can now download and access the data at any time, for any specified time range. The device’s operation can be tracked allowing notification of diagnostics such as loss of power or signal, which are a concern for this particular mine site.
Central Queensland
A more recent installation was in central Queensland at a mine site with a high level of instrumentation and monitoring. The sensor was installed together with a range of instruments and used by a PhD student as input into flotation model development. Because the trial was only for six weeks, the unit was not wired to the mine site’s existing infrastructure. Instead, the dashboard provided mine operations with an overview of the process variables over the trial period.
For this implementation, the graph at the bottom was altered (as per Example 2) to provide best-practice operating bands based on the time period chosen. The graph provides an indication of how current operation (orange line) compares with the mode and standard deviation. This can be flagged in the event log with the potential to raise an alarm or warning message, which can be pushed for instance to a computer, smart device or SMS message.
Summary
Information systems can now be implemented that allow fit-for-purpose visibility of high value operational issues using one-directional passive information flow to IoT dashboards.
This becomes a viable alternative to the trending and historian software solutions typically offered by higher-end Distributed Control Systems.
The IoT devices are sensor agnostic and can easily be integrated with legacy equipment commonly found in long life-of-mine operations.
This adjunct solution allows improvements to be driven at the supervisor or shift level.
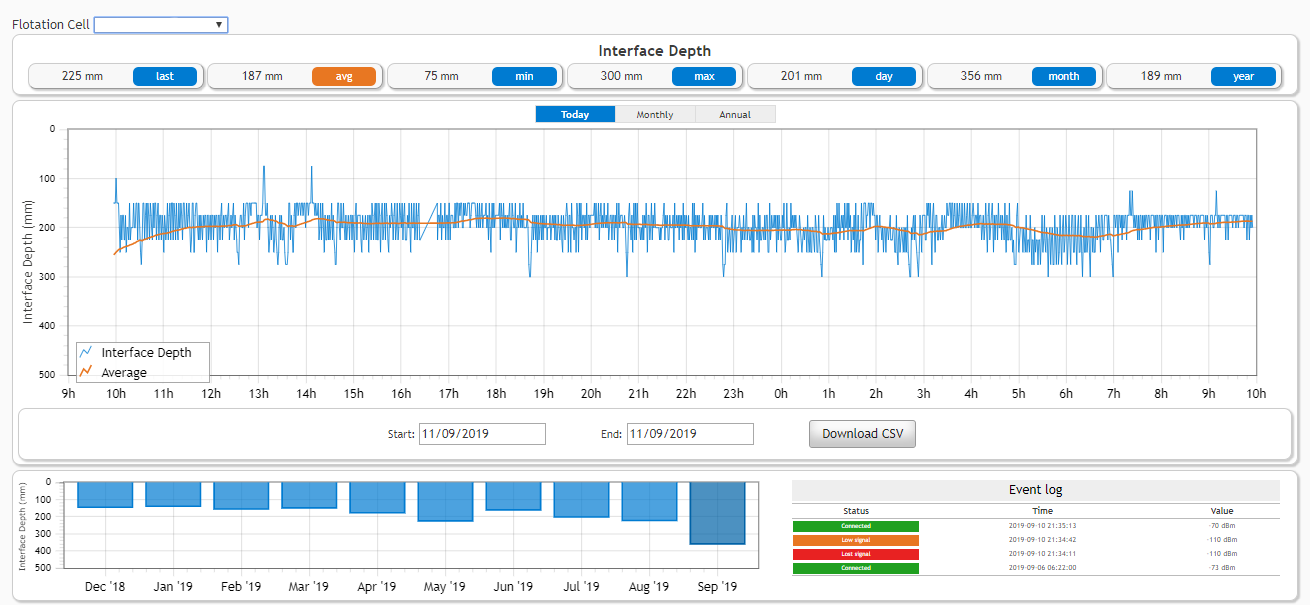
Example 1. Dashboard implemented for central Victoria.
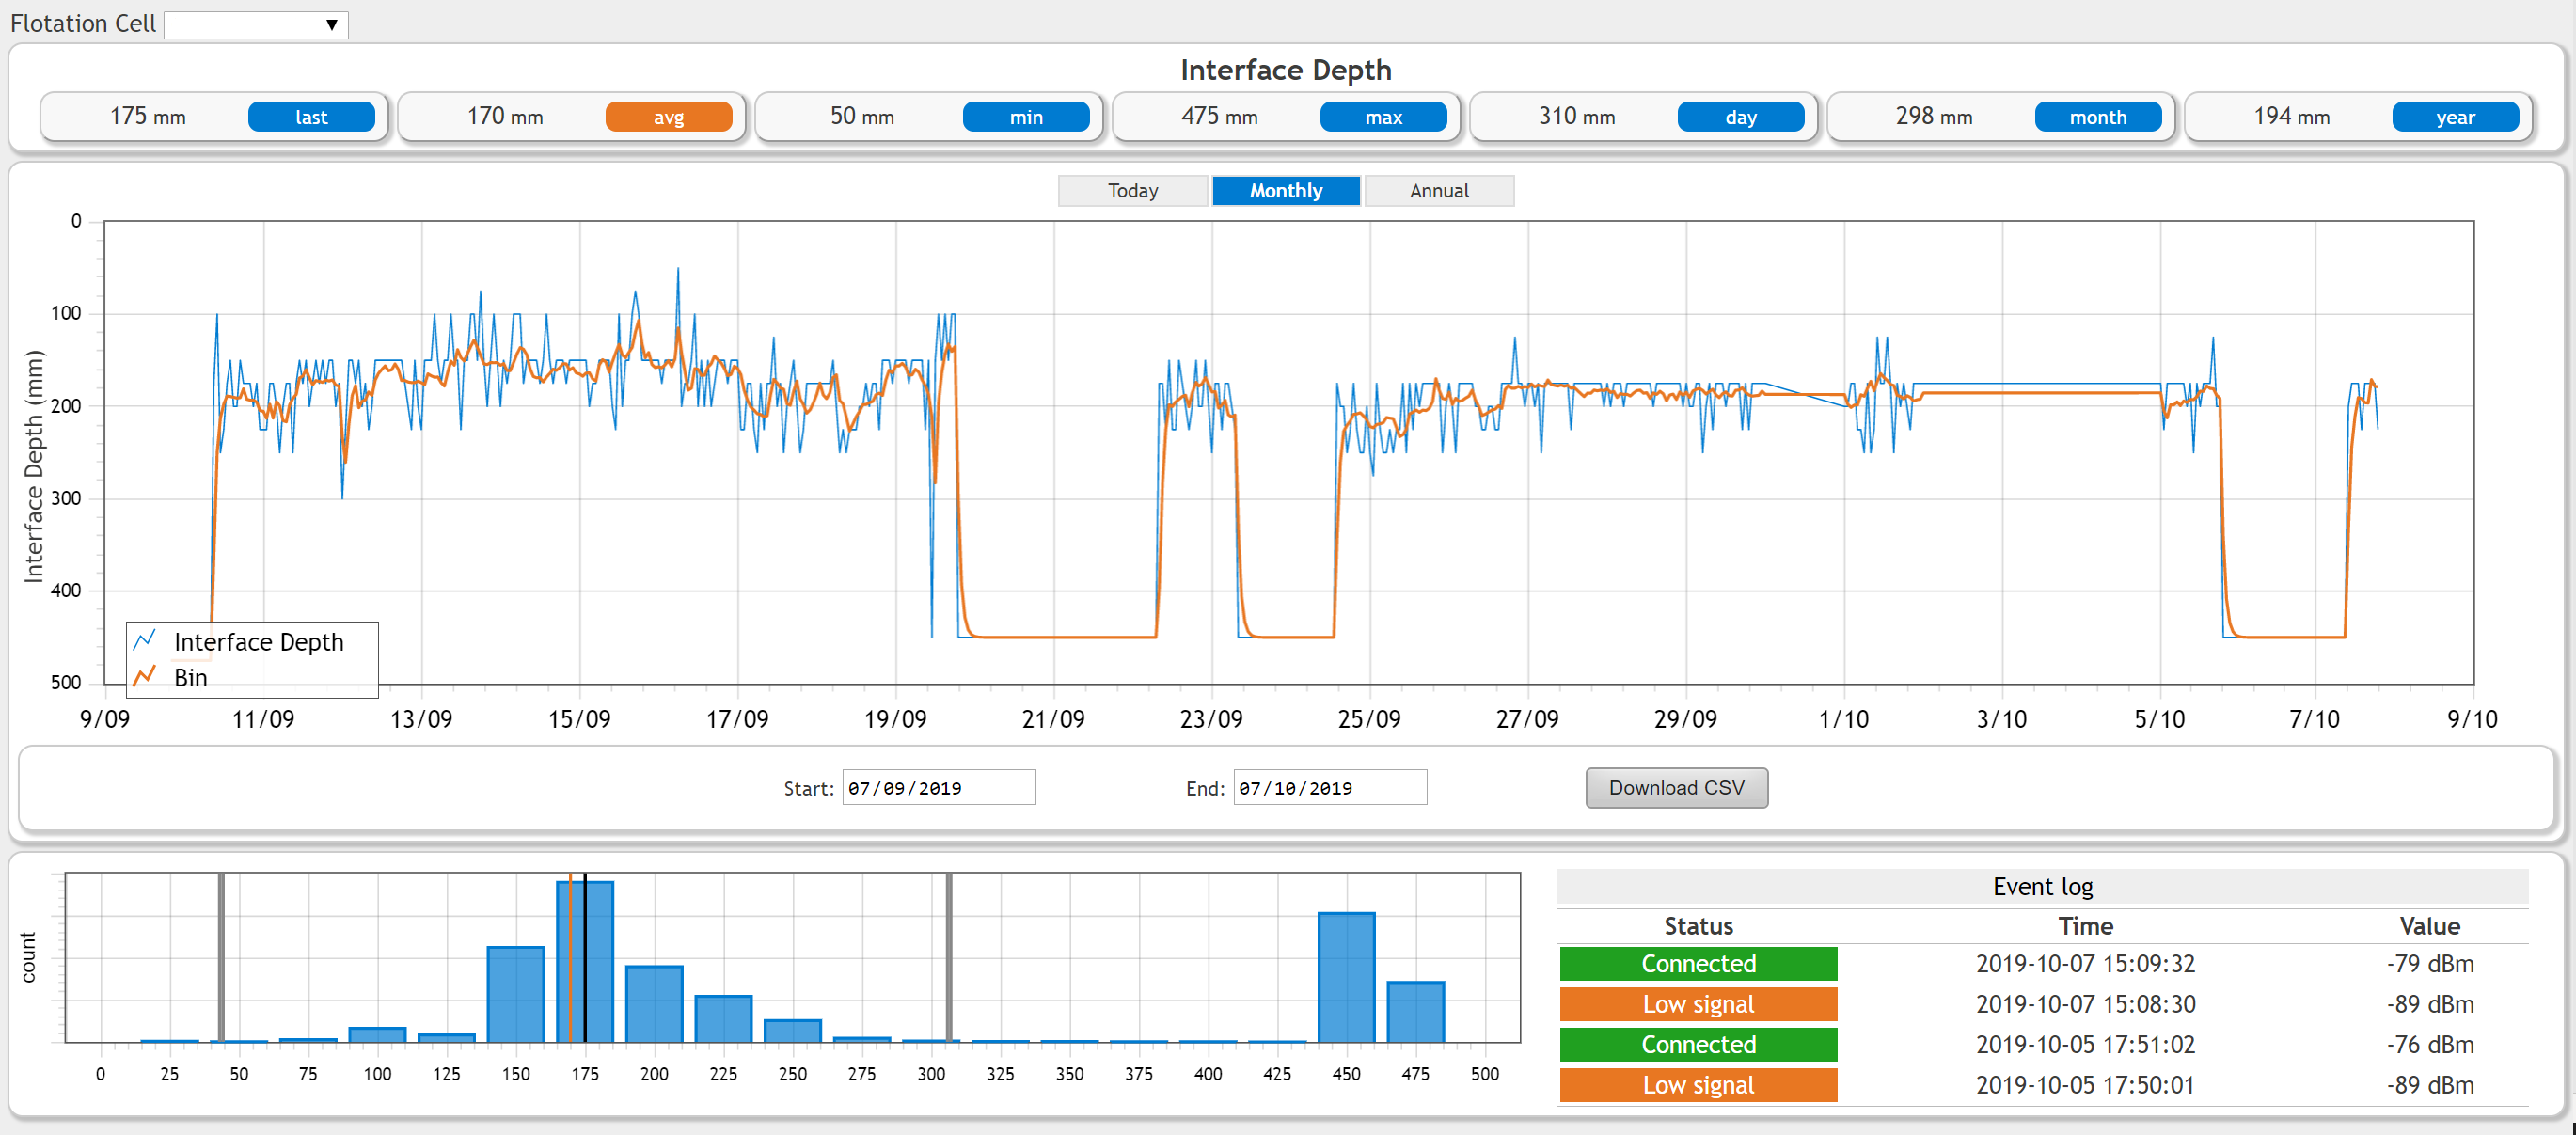
Example 2. Dashboard showing monthly overview and visualisation of operating bands.